KOFF CRM
KOFF CRM IS A COMPREHENSIVE FIELD SERVICE MANAGEMENT PLATFORM REPLACING TRADITIONAL CALL CENTER OPERATIONS FOR HOME REPAIR AND MAINTENANCE SERVICES. THE SYSTEM MANAGES INBOUND CUSTOMER ORDERS, TECHNICIAN DISPATCH ACROSS MULTIPLE UKRAINIAN CITIES, REAL-TIME PERFORMANCE TRACKING, AND LEAFLET DISTRIBUTION MONITORING. WORKING WITHIN AN EXISTING BOOTSTRAP FRAMEWORK, I REDESIGNED 6 CORE MODULES TO STREAMLINE OPERATOR WORKFLOWS, REDUCE TASK COMPLETION TIME, AND IMPROVE DATA VISUALIZATION FOR CALL CENTER STAFF AND MANAGERS.
THE CHALLENGE
THE PAIN
The existing CRM was built on Bootstrap with functional but cluttered interfaces. Call center operators faced several critical challenges:
- Information overload — too much data on single screens without clear hierarchy
- Slow order processing — multiple clicks and scattered information delayed order creation
- Poor visual organization — call history, orders, and live feeds mixed together
- Complex technician tracking — difficulty monitoring master availability across cities and service types
- Inefficient leaflet distribution monitoring — no clear visual system for tracking advertising campaign progress
- Limited real-time visibility — managers couldn't quickly assess call center performance
THE SOLUTION
This wasn't just a UI refresh — it required:
- Multi-role support: Call center operators, managers, technicians, leaflet distributors
- Real-time data: Live call feeds, technician status updates, order tracking
- Multi-city operations: Coordinating services across 6+ Ukrainian cities
- Bootstrap constraints: Working within existing framework limitations
- High-volume environment: Operators handling 50-75+ orders daily
DESIGN APPROACH & CONSTRAINTS
THE PAIN
Working within Bootstrap framework while significantly improving UX required strategic decisions:
- Maintain Bootstrap grid and components for development speed
- Enhance visual hierarchy through color, spacing, and typography
- Reduce cognitive load without removing necessary functionality
- Improve workflow efficiency without complete rebuild
THE SOLUTION
My process:
- Audit existing flows — identify bottlenecks in order processing
- Modular redesign — tackle one module at a time (call history, orders, statistics, tracking)
- A/B testing — create multiple variants, test with operators, choose best performer
- Bootstrap enhancement — custom CSS overlays on Bootstrap foundation
- Iterative improvements — continuous feedback from call center staff
CALL CENTER OPERATOR DASHBOARD
THE PAIN
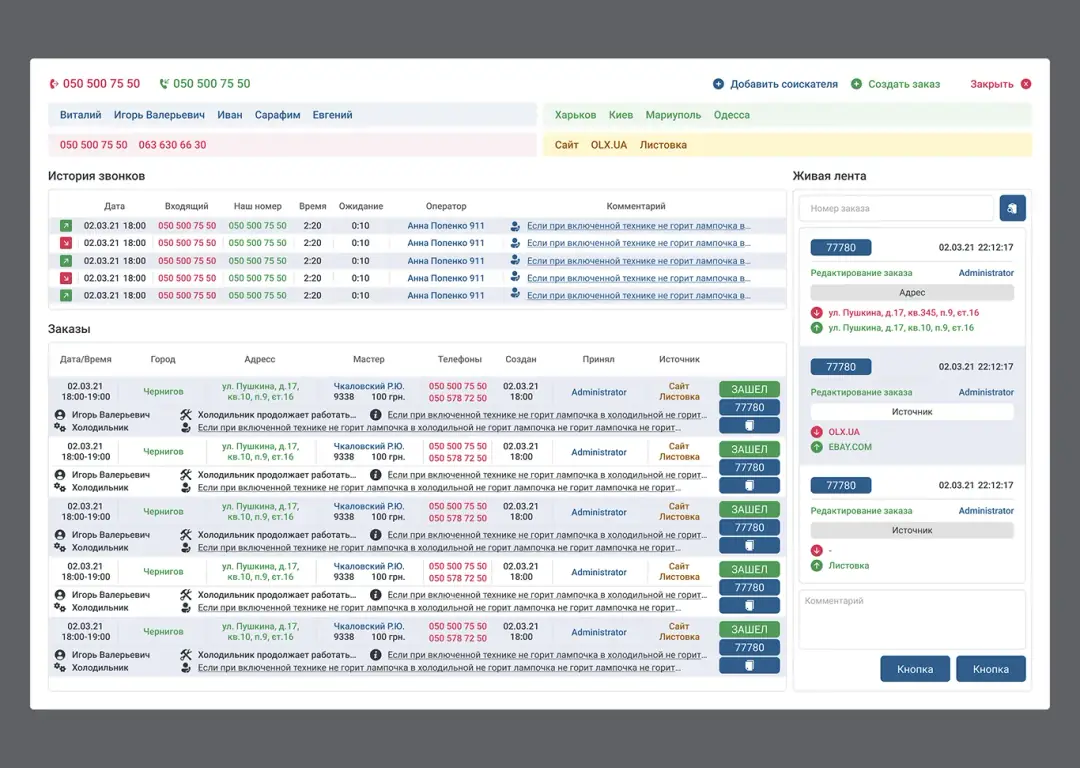
Operators needed to juggle three critical information streams simultaneously:
- Call history — tracking inbound/outbound calls with timestamps and durations
- Active orders — managing service requests with status, location, and technician assignment
- Live feed — real-time events requiring immediate attention
- The old interface mixed everything together, causing operators to miss critical information
THE SOLUTION
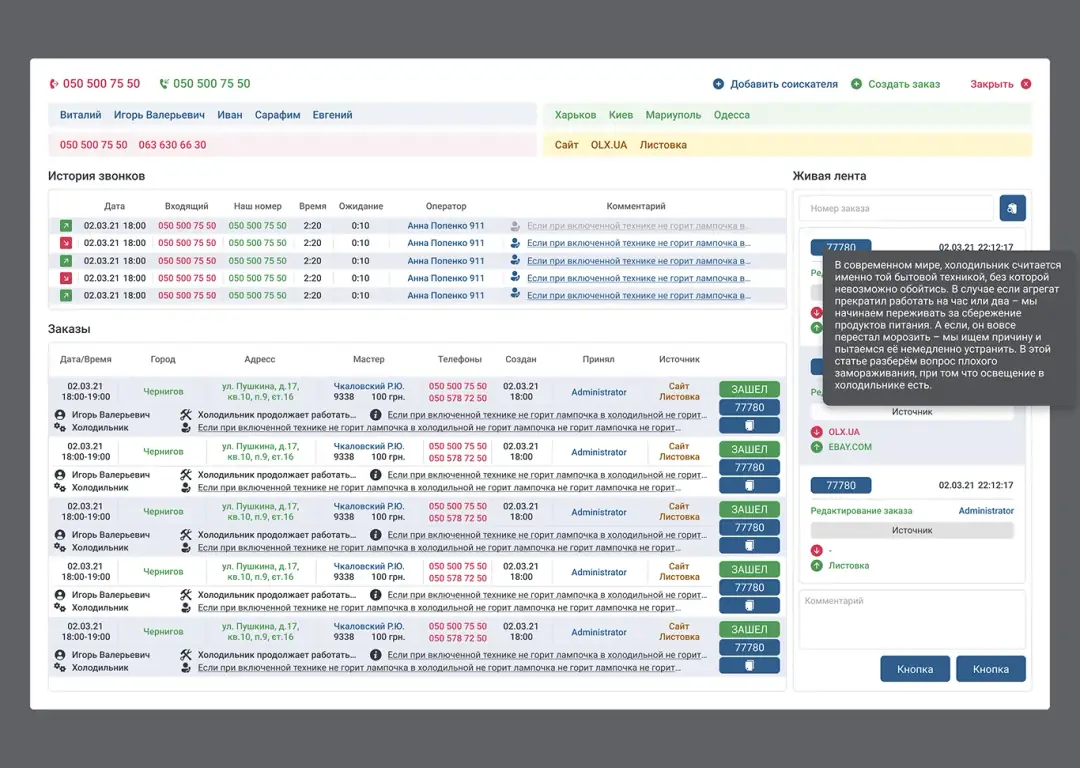
I redesigned the dashboard with clear visual separation and prioritization:
- Top Section — Caller Information
- Middle Section — Call History Table
- Bottom Section — Orders Table
- Right Sidebar — Live Feed (Живая лента)
- Results: 30% faster order processing — clearer layout reduced search time
- Reduced errors — color coding prevented address/phone mix-ups
- Better multitasking — operators could monitor calls, orders, and live feed simultaneously
LEAFLET DISTRIBUTOR TRACKING
THE PAIN
The company employed leaflet distributors to post advertisements in building entrances across multiple cities. Management struggled with:
- No visibility into who was working, available, or on break
- Unclear productivity — how many leaflets each distributor posted
- City-by-city coordination — difficult to balance workload across locations
- Time tracking — no clear view of distributor activity by time slot
THE SOLUTION
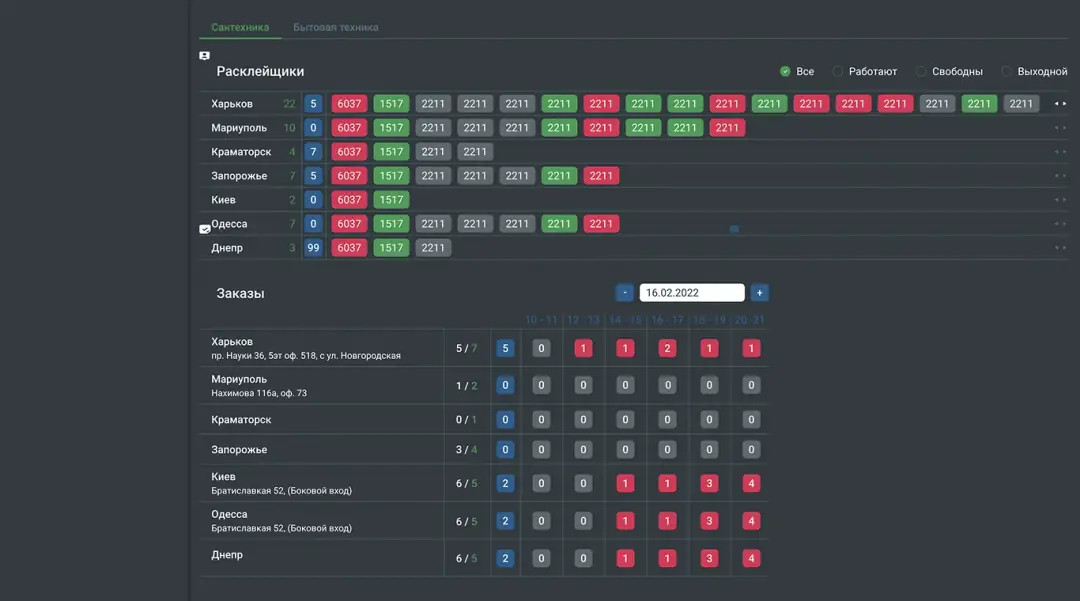
I designed a comprehensive tracking widget with real-time status indicators:
- Top Tabs: Сантехніка (Plumbing) / Бытовая техника (Appliances) for service type filtering
- Section Title: Leaflet Distributors
- Status Filters
- City-Based Table
- Bottom Section — Orders by Time Slot
- Results: real-time visibility — managers instantly saw distributor availability
- Better resource allocation — redistributed workload based on real-time data
- Improved productivity tracking — clear metrics per city and time slot
- Reduced coordination time — no more phone calls to check availability
ORDER PROCESSING INTERFACE
THE PAIN
Order processing was the core workflow for call center operators. The old interface suffered from:
- Scattered information — customer details, order status, and technician info on different screens
- Too many clicks — creating or editing orders required navigating multiple pages
- Poor status visibility — unclear which orders were new, in-progress, or completed
- Missing context — operators couldn't see full order history at a glance
THE SOLUTION
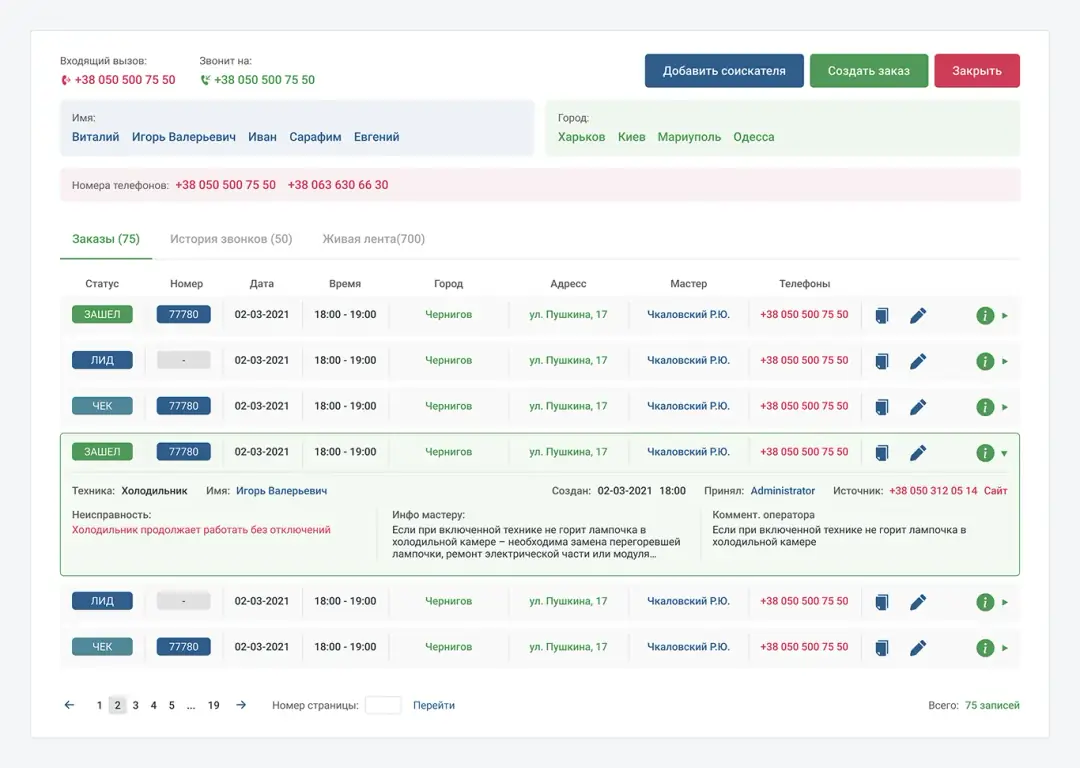
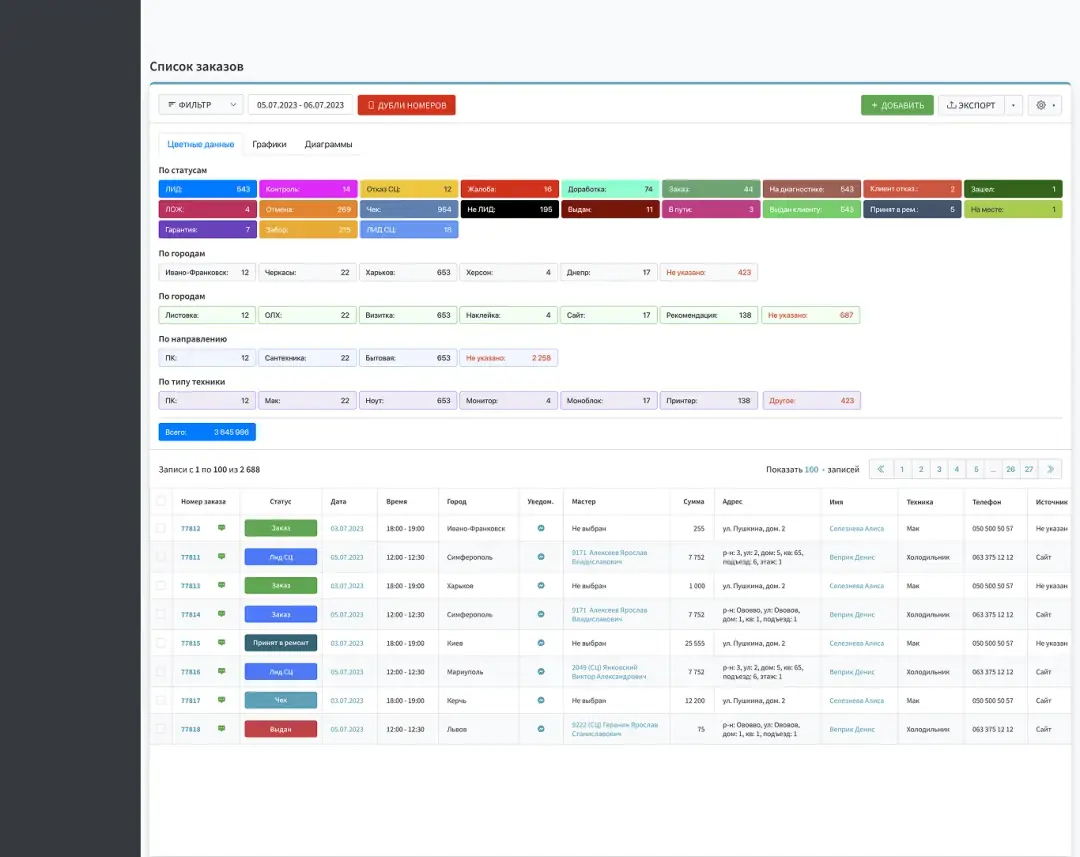
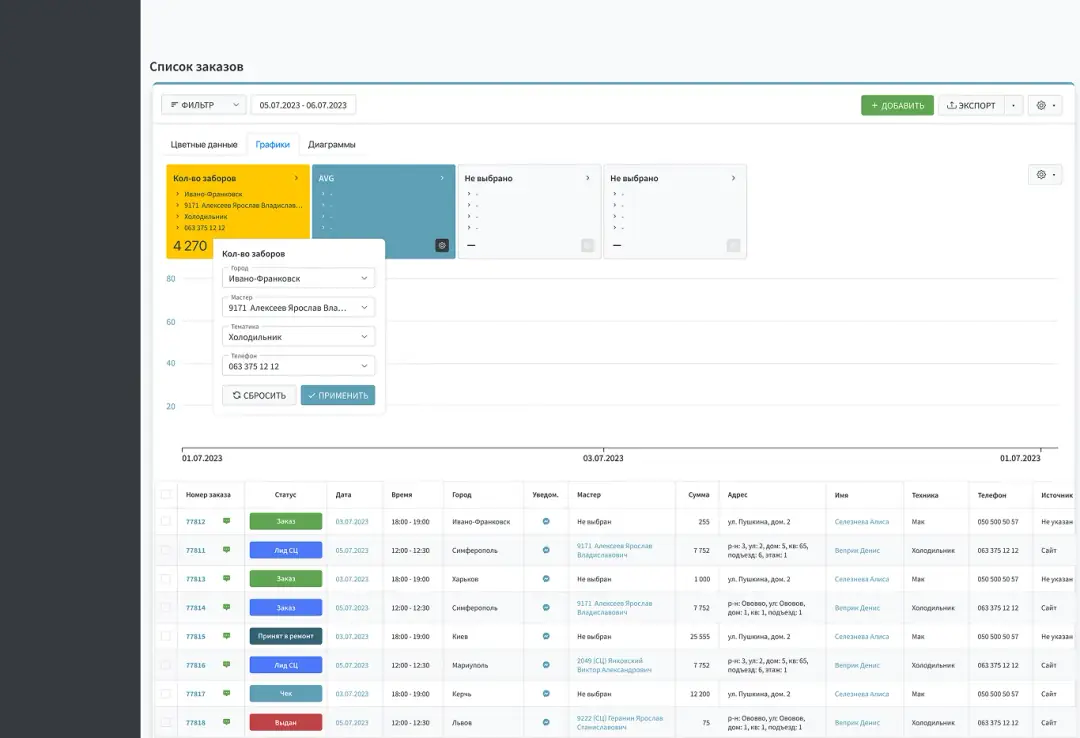
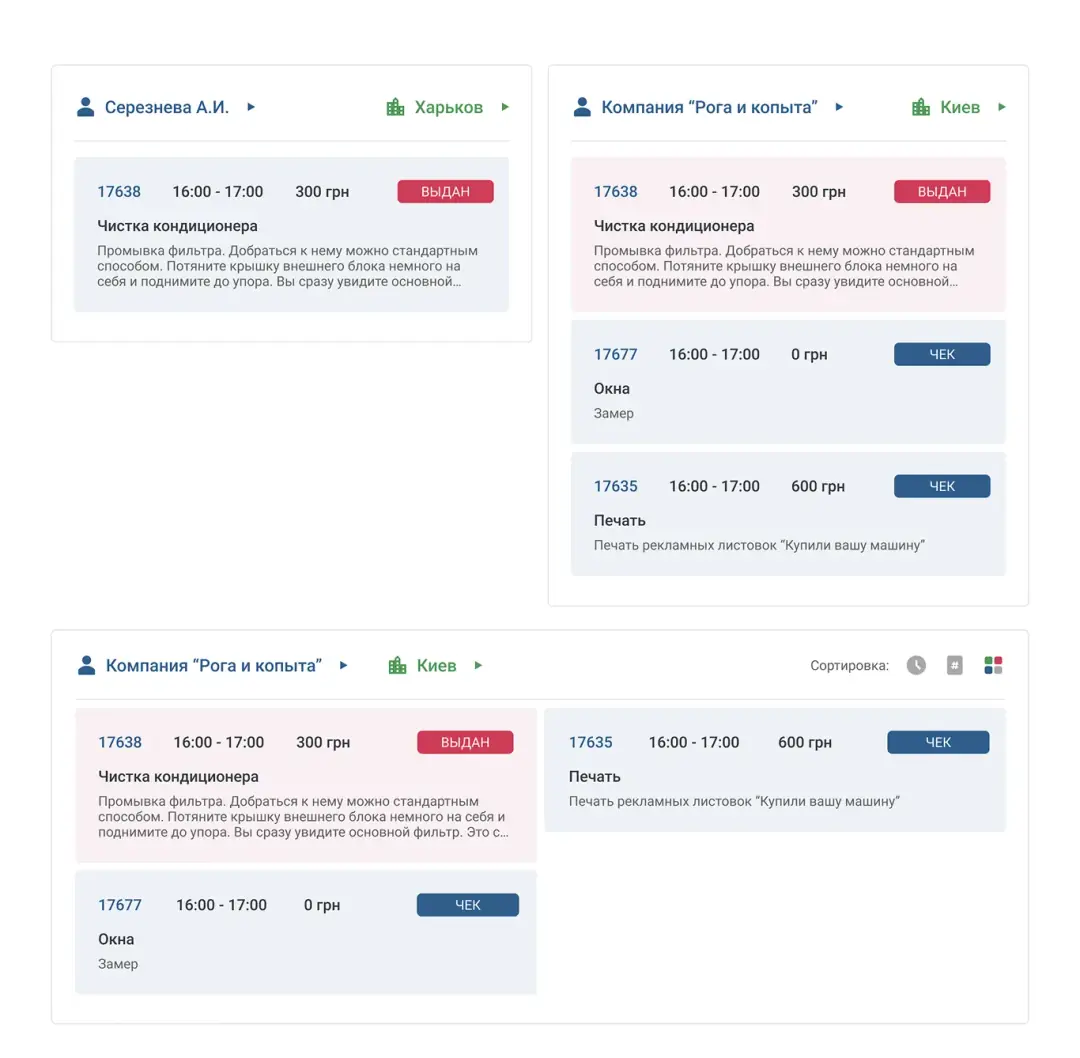
I designed a comprehensive order table with expandable details and quick actions:
- Top Section — Incoming Call Info
- Action Buttons
- Tab Navigation
- Orders Table
- Expanded Order Details (on click)
- Pagination
- Results: 50% faster order creation — all fields visible on one screen
- Reduced errors — clear status badges prevented duplicate processing
- Better customer service — operators saw full order history instantly
- Improved collaboration — comments and notes visible to all operators
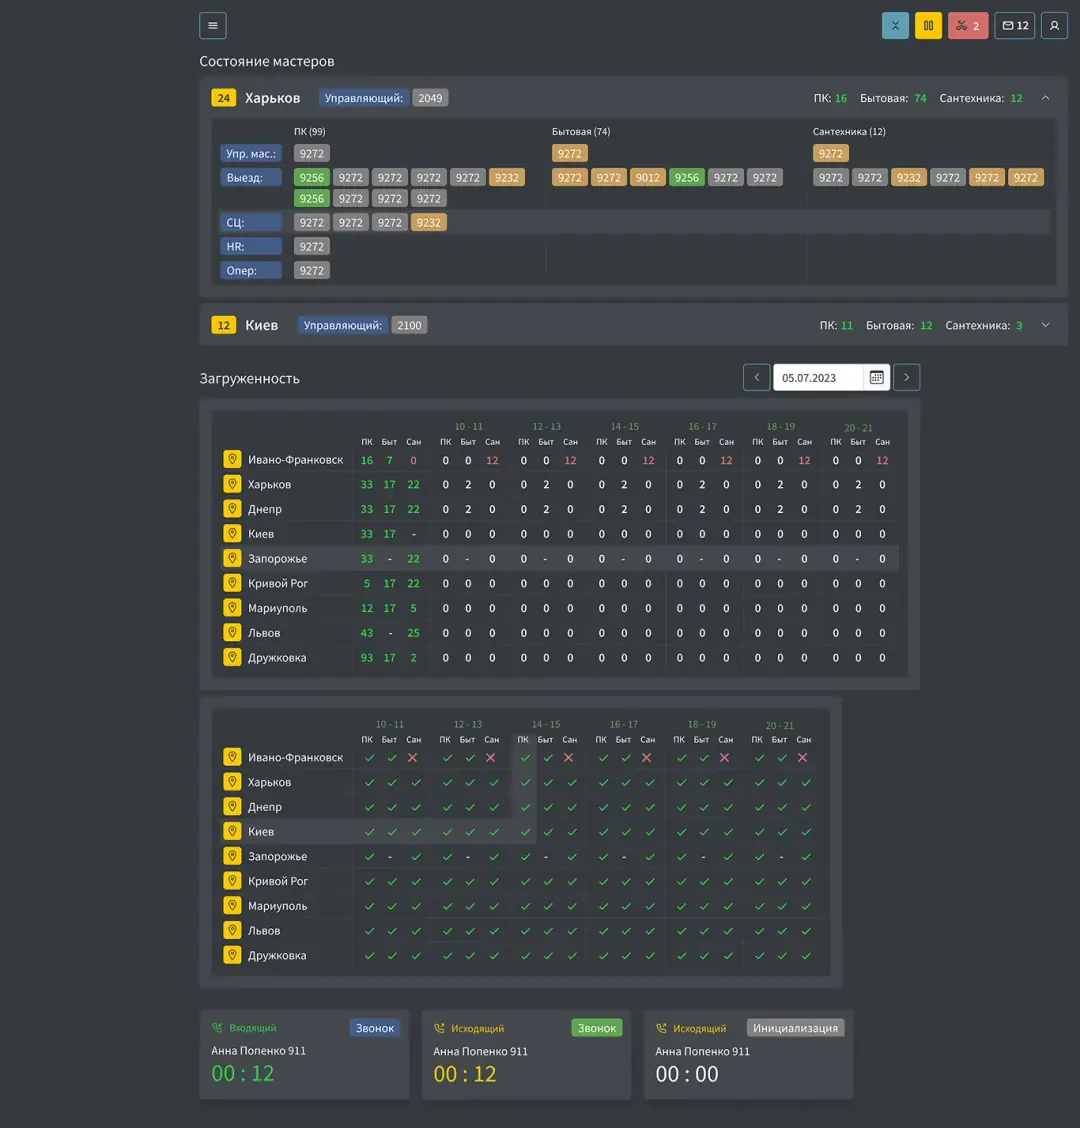
TECHNICIAN WORKLOAD DASHBOARD
THE PAIN
Managing technician workload across multiple cities and service types was chaotic:
- No real-time visibility — couldn't see which technicians were available
- Unclear capacity — difficult to balance assignments across staff
- Service type confusion — mixing plumbing, appliance repair, and other services
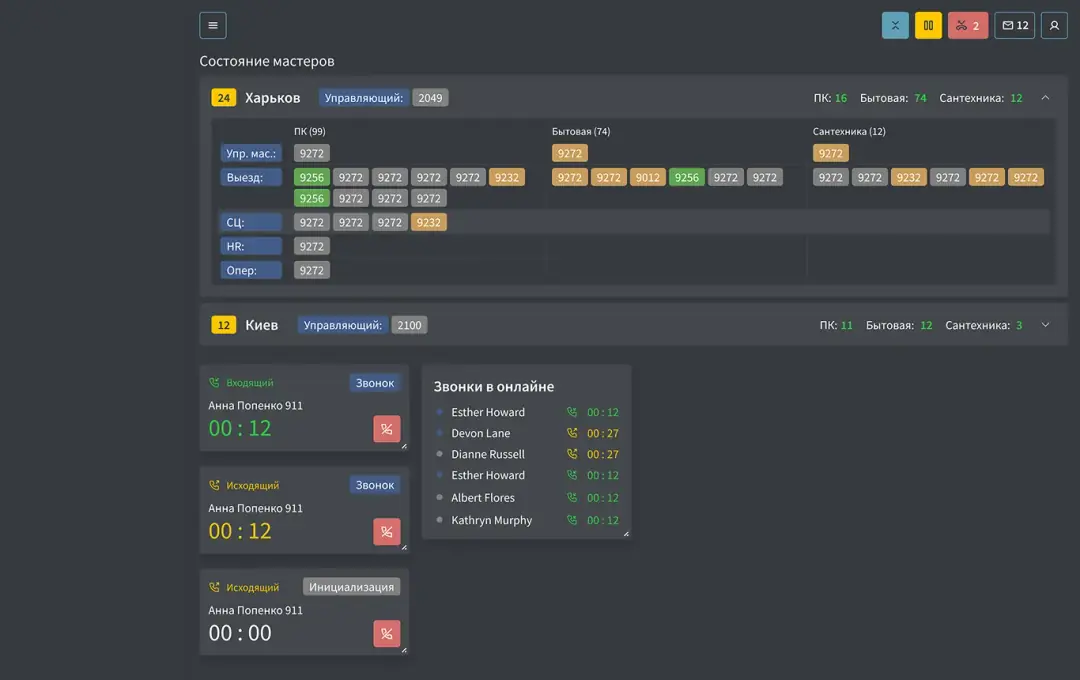
- SIP telephony integration — call status not visible in the same interface
THE SOLUTION
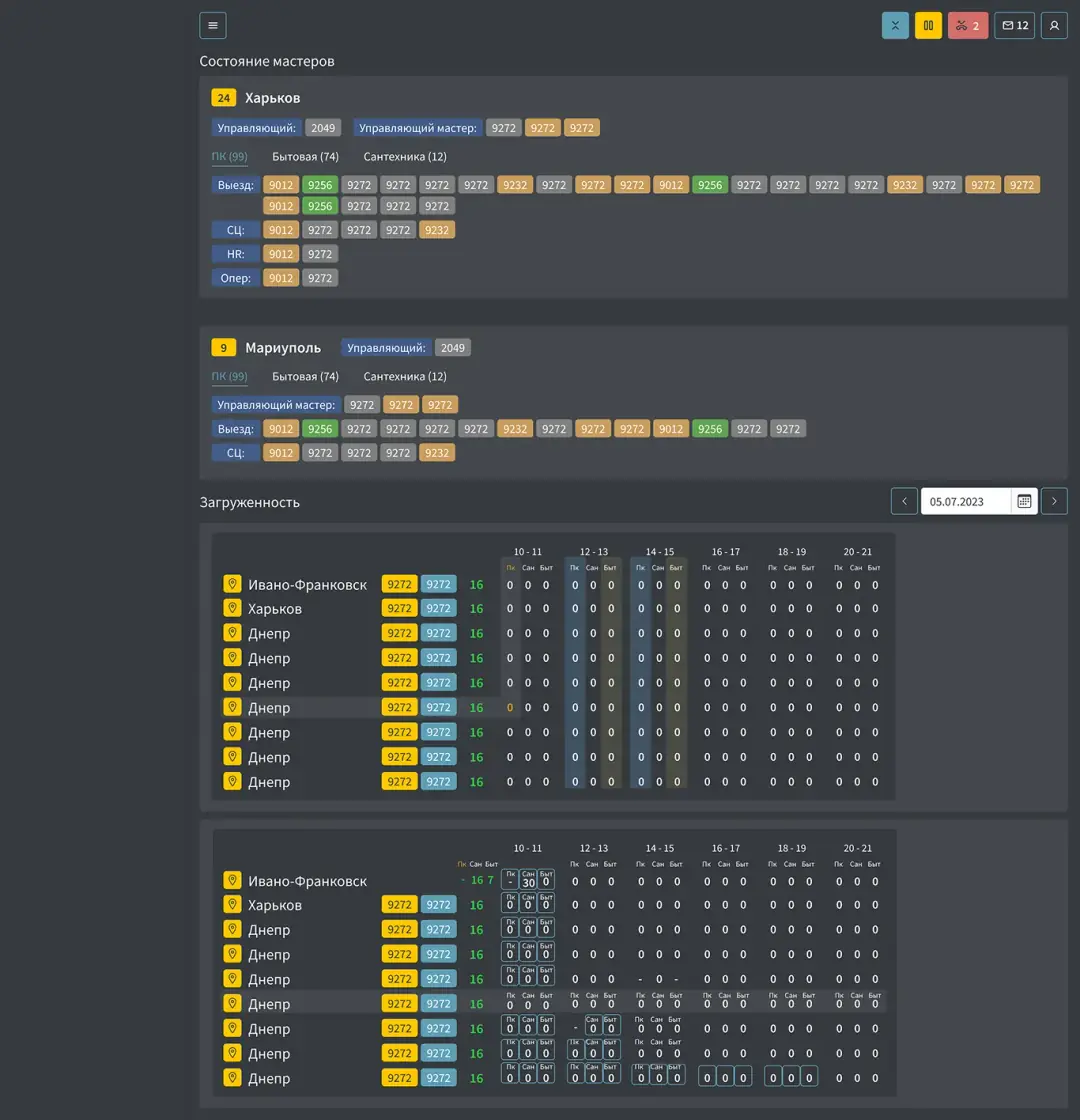
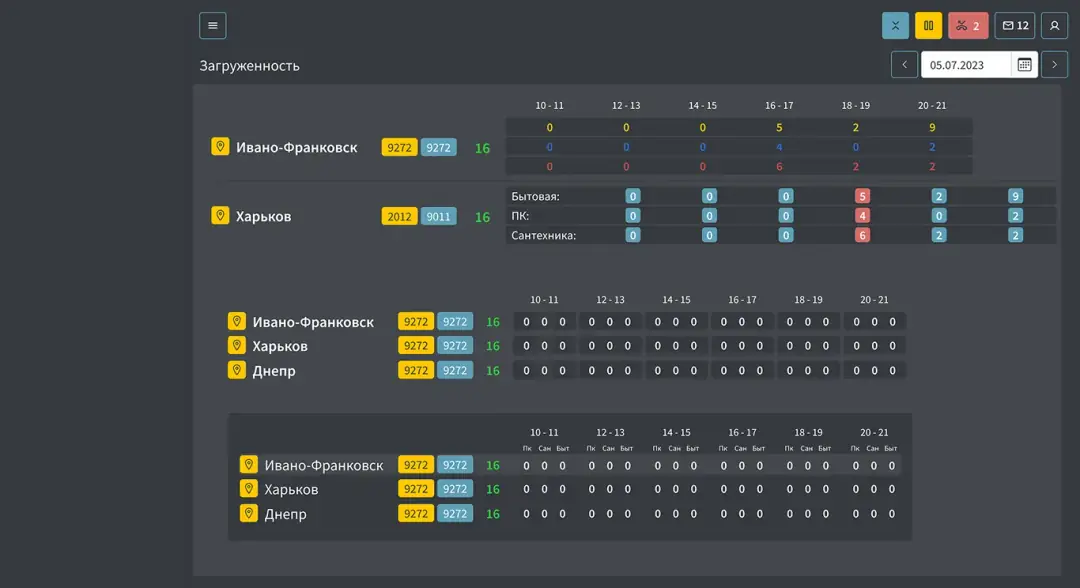
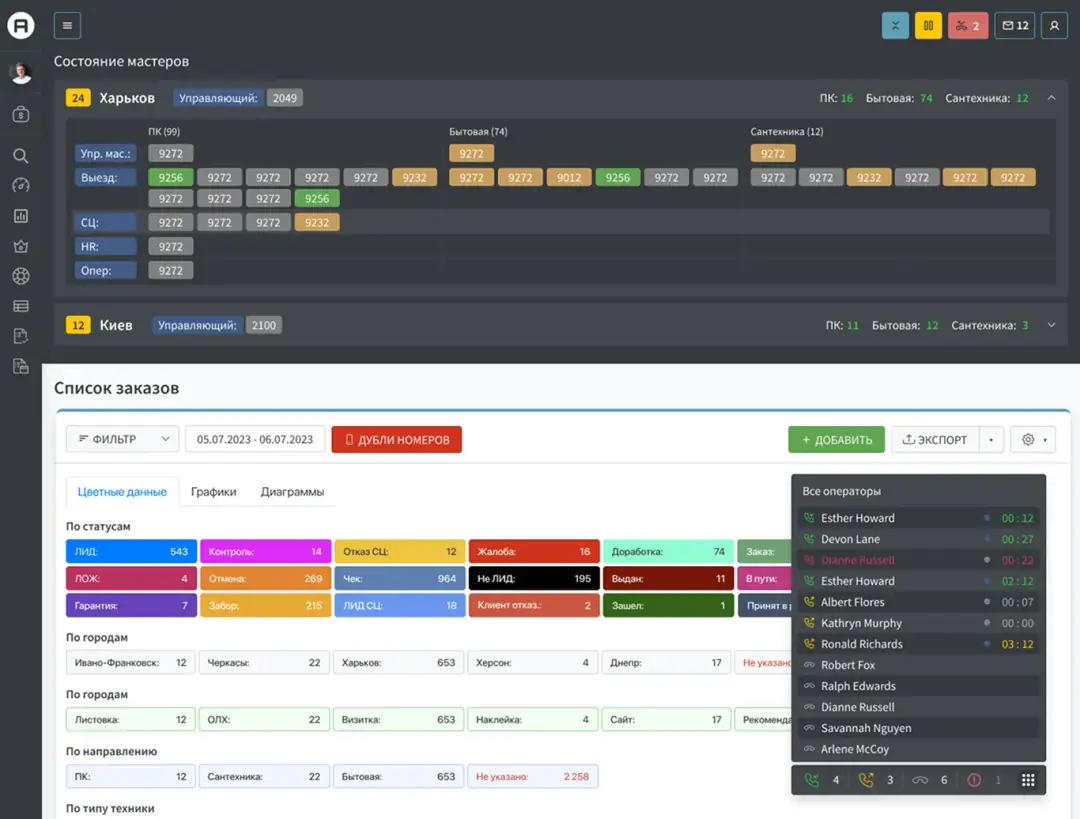
I designed a comprehensive dashboard showing technician status, workload, and telephony integration:
- Top Section — City-Based Technician Status
- Second City Block
- Middle Section — Workload by Time
- Bottom Section — Availability Grid
- SIP Telephony Widgets
- Results: real-time workload visibility — managers could balance assignments instantly
- Better resource utilization — reduced technician idle time by 25%
- Faster dispatch — available technicians identified in seconds
- Integrated telephony — call status visible without switching screens
LEAFLET DISTRIBUTION TRACKING MAP
THE PAIN
Monitoring leaflet distributors in the field was nearly impossible:
- No location tracking — couldn't verify if distributors were at assigned locations
- Unclear progress — no visual indication of completed vs. pending buildings
- Photo verification gaps — distributors claimed to post ads but no proof
- Route optimization — no visibility into efficient path planning
THE SOLUTION
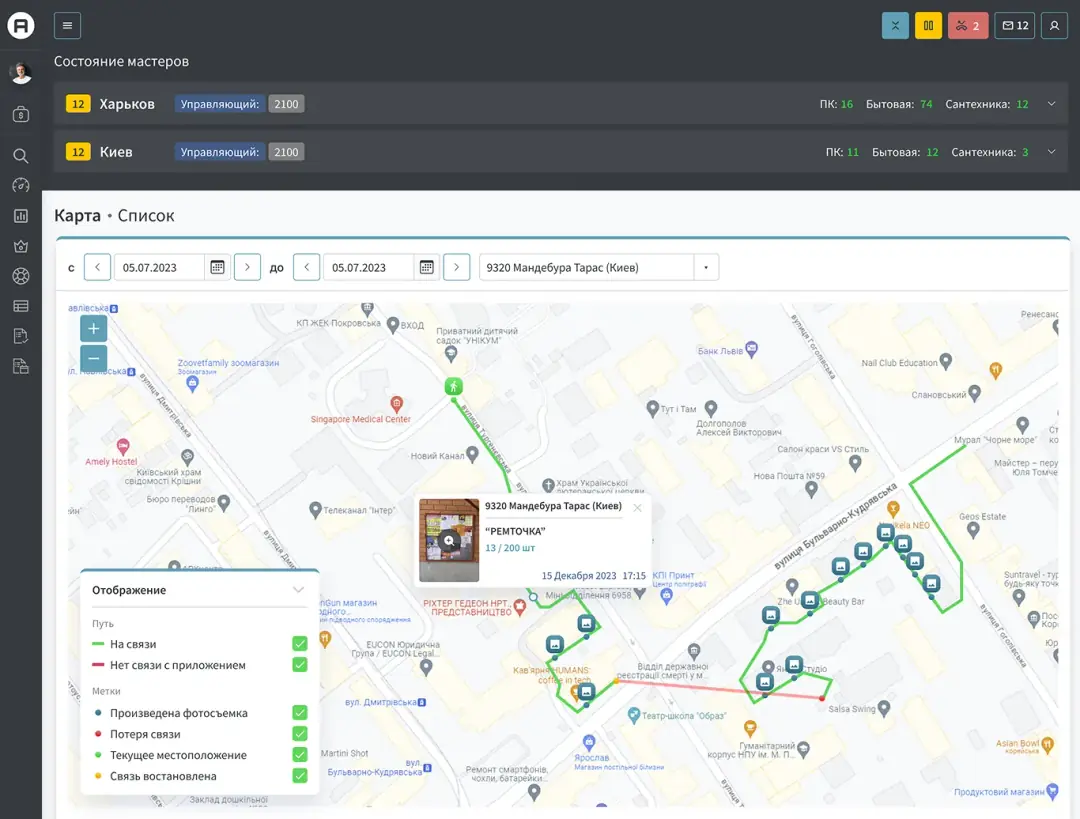
I designed an interactive map interface with real-time GPS tracking and photo verification:
- Top Section — City Selection
- Map/List Toggle
- Interactive Map
- Left Sidebar — Display Controls
- Map Features
- Results: verified distribution — photo proof for every posted leaflet
- Route optimization — identified inefficient paths, reduced travel time by 30%
- Real-time tracking — managers saw distributor location live
- Accountability — distributors knew their work was monitored
- Quality control — photos confirmed proper leaflet placement
MANAGER DASHBOARD
THE PAIN
Managers needed a bird's-eye view of call center performance but lacked:
- Consolidated metrics — data scattered across multiple screens
- Visual analytics — raw numbers without charts/graphs
- Performance trends — no historical comparison
- Team productivity — individual operator performance unclear
THE SOLUTION
Designed a comprehensive manager dashboard (mentioned but not shown in images) with:
- Call volume statistics by hour/day/week
- Operator performance metrics (calls handled, orders created, conversion rate)
- Revenue tracking by city and service type
- Technician utilization rates
- Customer satisfaction scores
- Interactive charts and graphs for trend analysis
BOOTSTRAP ENHANCEMENT STRATEGY
THE PAIN
Working within Bootstrap constraints while significantly improving UX.
THE SOLUTION
My Approach:
- Leveraged Bootstrap grid — maintained 12-column layout for consistency
- Custom CSS overlays — enhanced colors, spacing, and typography without breaking Bootstrap
- Component customization — modified Bootstrap buttons, tables, cards with custom styles
- Responsive design — ensured interface worked on various screen sizes
- Progressive enhancement — added JavaScript for real-time updates without full page reloads